The major aspects of the video “The Crumbling Business of Marijuana” focus on the dramatic collapse of the legal cannabis industry, the unique challenges of taxation and regulation, and the survival strategies of independent operators in California’s competitive market.
Industry Collapse and Commoditization
-
The legal cannabis industry has experienced a sharp downturn after initial promises of massive profits, widespread social change, and job creation.
-
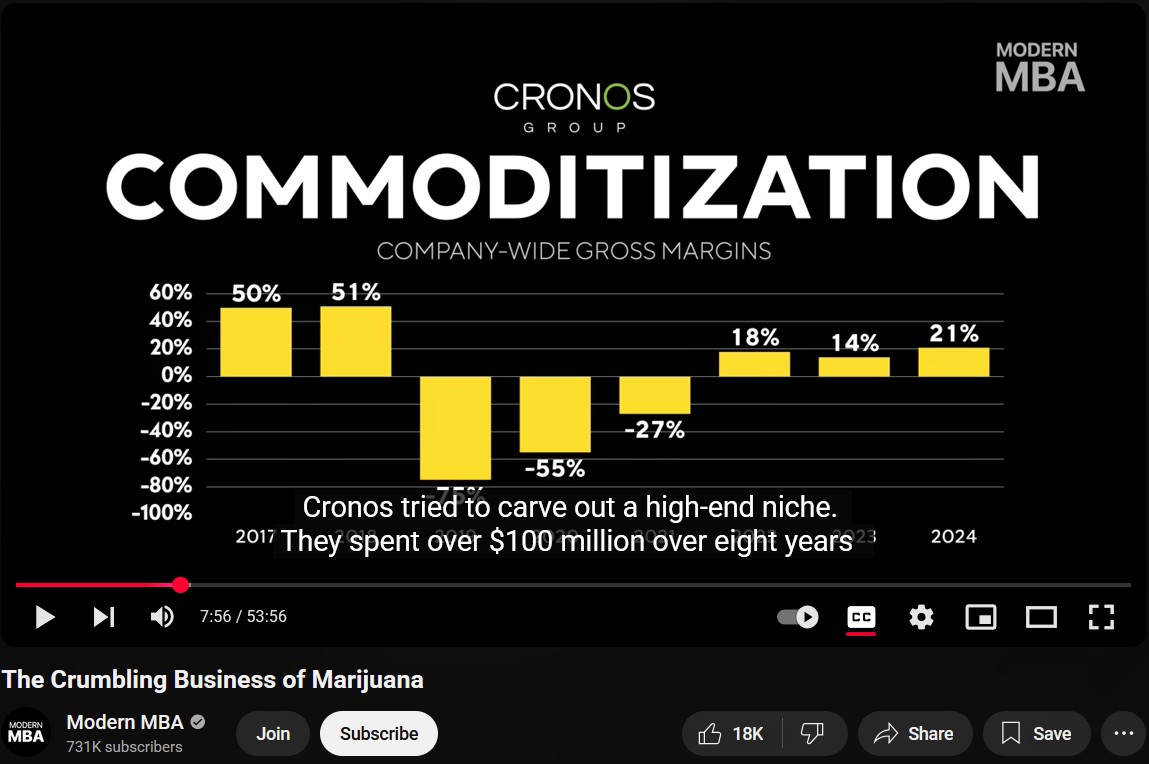
Market oversaturation and commoditization led to a “race to the bottom,” where only price competition remains.
-
Despite the collapse, some small, independent dispensaries survive by focusing on profitability rather than scale.
The “Green Rush” and Corporate Failures
-
The Green Rush started in 2012 when states like Colorado and Washington legalized recreational marijuana.
-
Corporations like Tilray, MedMen, Cronos, and Curaleaf expanded rapidly, burning through venture capital and private equity.
-
Most large companies failed due to high debt, poor operational practices, inability to compete across state lines, and unsustainable expansion models.
Taxation and Regulatory Challenges
-
Cannabis is taxed at much higher rates than alcohol or tobacco, especially at the retail level, leading to legal prices up to 40% higher than the black market.
-
Layers of excise, city, and sales taxes compound one another, and new tax hikes are set to increase rates further.
-
Regulatory hurdles limit interstate commerce, banking, and research, keeping federal legalization out of reach.
Survival Strategies in California
-
California is the largest cannabis market, but it battles $5.1 billion in legal sales alongside an estimated $8 billion black market.
-
Independent operators like Noelle (Mecca), Jay (ERBA), and Bobby & Nick (HERB) each use tailored strategies:
-
Noelle (Mecca): Vertical integration, local focus, quality control, and competitive pricing.
-
Jay (ERBA): Consignment marketplace model that minimizes inventory risk, focuses on relationships, and offers a diverse product range.
-
Bobby & Nick (HERB): Lean, customer-focused delivery service with high-touch customer service and low operating costs.
-
Market Dynamics and Business Models
-
Price wars and product selection dominate retail strategies, with emphasis on popular strains and quality assurance.
-
Consignment and vertical integration are successful models for minimizing risk and building brand trust.
-
Delivery services face higher failure rates than brick-and-mortar dispensaries, showing the importance of adaptability and niche focus.
The Role of Policy and Politics
-
The video concludes that poor governance and self-serving political decisions contributed to the collapse more than market forces alone.
-
Politicians prioritized short-term tax revenue and licensing fees over sustainable industry health, treating cannabis as an infinite money source.
-
The narrative closes by highlighting the persistence and acumen of small, bootstrapped operators—the true survivors and innovators in a turbulent industry.
The video mentions several notable cannabis businesses, focusing on both major corporations and independent operators in California.
Major Corporations
-
Tilray: Early mover, went public, merged with Aphria, now struggling despite scale.
-
MedMen: Known for upscale dispensaries, faced bankruptcy after rapid expansion.
-
Cronos: Tried to create luxury cannabis products, still facing heavy losses.
-
Curaleaf: Largest by revenue, but operates at a loss due to debt-driven growth.
-
Trulieve: Major operator in Florida, but facing declining sales despite large market share.
-
Green Thumb: Only consistently profitable public cannabis retailer/manufacturer, but with shrinking margins.
Independent Operators in Los Angeles
-
Mecca (Mid City): Owned by Noelle, vertically integrated dispensary, known for local focus and quality control.
-
Signal: Cultivator, manufacturer, and distributor linked to Mecca, operated by Noelle.
-
ERBA: Owned by Jay, operates as a consignment marketplace with multiple locations.
-
HERB: Founded by Bobby and Nick, LA’s longest running independent cannabis delivery service.
Summary Table
| Business | Type | Notes |
|---|---|---|
| Tilray | Major corporation | Publicly traded, merged with Aphria |
| MedMen | Major corporation | Upscale dispensaries, filed bankruptcy |
| Cronos | Major corporation | Luxury focus, heavy losses |
| Curaleaf | Major corporation | Largest by revenue, unprofitable |
| Trulieve | Major corporation | Florida focus, declining sales |
| Green Thumb | Major corporation | Profitable, but shrinking margins |
| Mecca | Independent dispensary | Local focus, vertical integration |
| Signal | Cultivation/manufacturing | Linked to Mecca, controlled by Noelle |
| ERBA | Independent dispensary | Consignment model, marketplace approach |
| HERB | Delivery service | Founded by Bobby and Nick, LA-based |
The video includes several key graphs to support its analysis, each with specific metrics that highlight the economic trends and industry dynamics for legal cannabis.
List of Graphs and Metrics Used
1. Legal vs. Black Market Cannabis Sales in California
-
Metrics Used:
-
Legal cannabis market size (annual sales, in billions of dollars)
-
Black market cannabis market size (annual sales, in billions of dollars)
-
Geographic focus: overall California, highlighting Los Angeles County
-
-
Graph Description:
-
Comparative bar or stacked chart showing $5.1 billion legal vs. $8 billion black market sales in California for 2023, with LA County as the dominant sub-market.
-
2. Wholesale and Retail Price Decline
-
Metrics Used:
-
Wholesale price change percentage for cannabis (4-year trend, -70%)
-
Retail price drop for cannabis (most common quantities like an eighth of an ounce, -42%)
-
Retail prices of popular products: flower, edible, pre-roll, vape cartridge
-
-
Graph Description:
-
Line or bar graph illustrating steep declines in wholesale and retail prices, possibly broken down by product type over time.
-
3. Declining Legal Sales and Tax Revenue
-
Metrics Used:
-
Year-over-year legal sales volume (annual trend)
-
Tax revenue from cannabis sales (absolute values and trend line for California since 2018)
-
-
Graph Description:
-
Line graph showing falling legal sales and corresponding drop in tax revenue, including compound tax rates and comparison to historical highs.
-
4. Tax Breakdown on Legal Cannabis
-
Metrics Used:
-
Specific taxes: state excise tax (percent), sales tax (percent), city tax (percent)
-
Total effective tax rate (current: 35%, upcoming: 39%)
-
Average retail price impact for each product due to taxes
-
-
Graph Description:
-
Pie or stacked bar chart showing the effective tax burden on a sample purchase, with breakdown by tax type and increase scheduled for July 2025.
-
5. Business Closures by Segment (California)
-
Metrics Used:
-
Licensed cultivators (businesses shuttered: 7,500 out of 11,500 = 65%)
-
Distributors (fraction closed: 1 out of 2)
-
Dispensaries (closed: nearly 4 out of 10)
-
-
Graph Description:
-
Bar or waterfall chart showing attrition rates for growers, distributors, and dispensaries over the last 5 years.
-
6. Store Revenues and Margins for Featured Independents
-
Metrics Used:
-
Gross annual sales and operating margin (%): Mecca ($8 million + $1.1 million Signal; 25%), ERBA ($35 million; 12%), HERB ($3 million; 5%)
-
Special event sales spikes (Mecca: 4/20 sales of $74,000/day)
-
-
Graph Description:
-
Comparative bar chart displaying annual sales and operating margins, with special annotation for exceptional days or events.
-
7. Regulatory Tax Comparison Across Alcohol, Tobacco, Cannabis
-
Metrics Used:
-
Excise tax rates by product type (alcohol, cigarettes, e-cigarettes, cannabis)
-
Point of tax imposition (manufacturer, wholesaler, retailer)
-
Cannabis vs. other drugs: rate and base (retail gross sales vs. net wholesale price)
-
-
Graph Description:
-
Comparative bar or pie graph showing tax structures and rates by product, emphasizing cannabis’s unique, high tax burden at retail.
-
These visualizations collectively illustrate the macroeconomic collapse, competitive landscape, tax pressures, and survival tactics in California’s cannabis industry.
The cannabis strains specifically mentioned in the video are:
-
Gelato
-
Wedding Cake
-
Blue Dream
-
Biscotti
-
Strain names used for illustration of branding: Donkey Butter, Cheetah Piss, Apple Fritter
These strains were cited as examples of popular or bestselling varieties in California, as well as to showcase the creative branding and variety of strains in the current market.